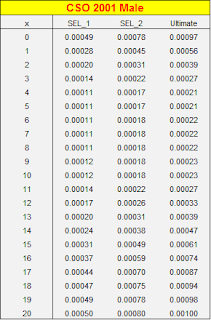
In light of these, a static morality curve is unlikely to make a fair prediction on reality. Hence actuaries have developed the select and ultimate table, in order to use different mortality rate after the first few years the insurance contracts have been inforced.
The graph above shows a typical select and ultimate mortality table. The SEL_1 column is used for the 1st policy year after the policy is issued, SEL_2 for 2nd policy year, and Ultimate for years thereafter.
For example, consider a contract entered at age 15, male, the death rates used during its 1st, 2nd, 3rd and 4th policy years will be respectively:
1st policy year (2017): 0.00031
2nd policy year (2018): 0.00059
3rd policy year (2019): 0.00074
4th policy year (2020): 0.00087
Another notable issue is that, when calculating the mortality rate, actuaries will used a multiplicative factor called "selection factor". It is a single percentage (eg: 80%) to be multiplied to the rate read-in from the mortality table. The reason for adding this multiplicative term is because, while the mortality table is collected via population census which represents the whole population, insurance contracts are more likely to be purchased by a specific group within the population (eg: middle class), hence using the population data directly is inappropriate and biased.
Insurance companies will perform experience analysis yearly (or more frequently) to evaluate its own actual death / lapse experiences against expected rate. After experience analysis, insurance companies will conclude an appropriate selection factor, then apply this to the mortality table.
For example, consider the same contract as above, a contract entered at age 15, male, and the selection factor applied is 60%.
1st policy year (2017): 0.00031 * 0.6 = 0.000183
2nd policy year (2018): 0.00059 * 0.6 = 0.000355
3rd policy year (2019): 0.00074 * 0.6 = 0.000522
4th policy year (2020): 0.00087 * 0.6 = 0.000564
A demonstration spreadsheet showing select & ultimate mortality table, lapse table and basic contract information can be downloaded here:
https://drive.google.com/file/d/0B4OirwHLcmE1amVEYTFqQThzLXc/view?usp=sharing
https://drive.google.com/file/d/0B4OirwHLcmE1amVEYTFqQThzLXc/view?usp=sharing


No comments:
Post a Comment